

#1 Thu, Sep 15, 2011 - 9:46am

Dollar Index vs Gold Spot Chart - 30 Day
As we look at trendlines, at least for me, I can sometimes get focused on the macro picture over several months without bothering to stop to look at a smaller window. In today's market (if we can call it that), the micro snapshot seems to becoming a more telling picture of the current market condition. With the downward pressure on gold as it is prices in FRNs, I put together a quick chart on the 30 day (See Below)........
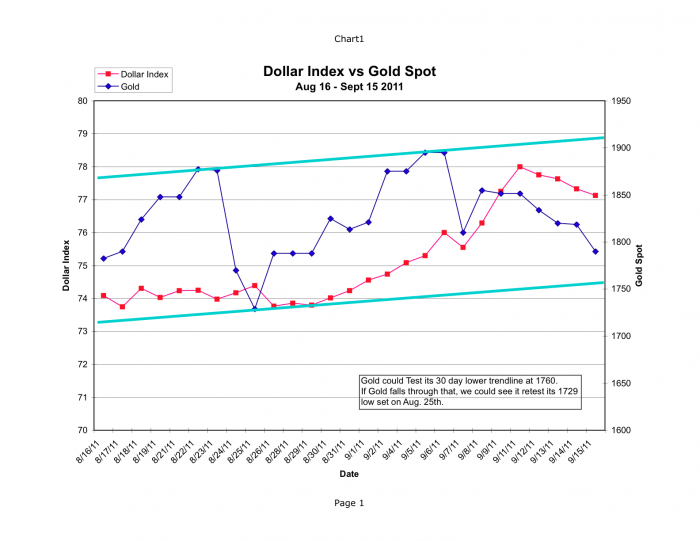
The slope of a smaller window, by ignoring a larger data set, can get skewed into being too steep or too shallow, but, in this case, I think it gives a good idea of the bottom support for the next couple of days at 1760. It could possible retest its low set on Aug. 25th of 1729.
Edited by: Be Prepared on Nov 8, 2014 - 5:31am


