


There are many fundamental factors which contribute to the price valuation given to gold at any time. At the same time gold is valued by reference to it's comparative efficacy to other assets as: a non national (foreign) currency, a zero coupon AAA (and better) bond type asset, an inflation hedge, a hedge against systemic risk as per eg collapse or loss during war or catastrophe.
So I got to thinking that it might be interesting to look at repeating alleged cycles in the frequency and size of wars, and interpret those cycles by looking at the behaviour of the gold market during those historic times. So hopefully for every war cycle there would hopefully be a similar lead up period, and some similarity during it's crest and decline of current waves when compared with earlier waves of that particular war cycle.
The (alleged) war cycles I chose to work with are the following:
142 years
57 years
22 1/2 years
12 1/4 / 9.6 years (either one or the other dominates)
11 1/2 years
The 12 year cycle seems to be subdued during recent years so for this one I worked with the 9.6 year wave which seems to increase when those two are not in contest with each other.
So the cycles I worked with, and the date in the past corresponding with today (August 2014) are as follows:
142 years ... charts not available and difficult to compare with today
57 years ... 1957
22 1/2 years ... Jan 1992
11 1/2 years ... Jan 2003
9.6 years ... Jan 2005
It's interesting to see that August this year should be compared to January of the previous waves for three of these (war) cycles in the gold price. This may have repercussions to the reliability of seasonal charts and their predictions during the latter half of 2014. Subject to the approximate dimensions of these long term waves of course.
I considered looking into gold against logarithmic demographics, as in Secular Cycles and Millennial Trends by Korotayev, Malkov, and Khaltourina ( https://escholarship.org/uc/item/9c96x0p1#page-1 ) but the timescale is just too long for practical use, though the idea fascinates.
So I took the most well researched international war cycles instead and began to see what elements of the previous wave might be repeating, in modified modern form) this time round. If the act of war or the threat of war affects the price of gold, then looking at the same stage of a previous war cycle should hopefully compare in some way to the present price, provided the periods measured are an exact whole (complete) number of cycle waves apart.
The farther back in time I went the more I have used comparisons rather than absolute value prices - ratio with other markets, and logarithmic display, detrending against in inflation index to normalize data and make it "look similar". As they come into recent years I just compared the price of gold then with the price now.
57 Year war cycle last time round looking first at the price of stocks
Courtesy of www.macrotrends.net: Gold - inflation adjusted against CPI
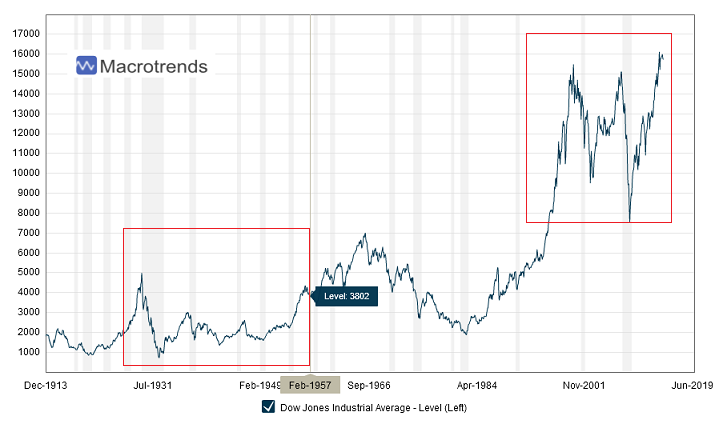
Observation: In both cases a large trading range is nearing or at completion with stocks attacking new highs.
57 year war cycle last time (looking in gold price vs stocks):
Courtesy of www.macrotrends.net: Gold against S&P 500
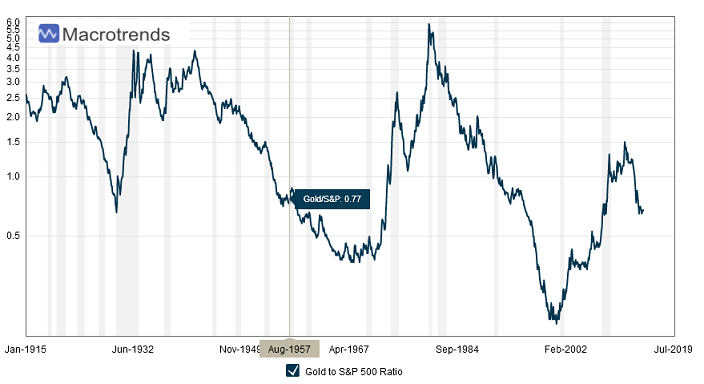
Observation: the stocks to gold ratio is presently at a similar level at it was at this stage of the last wave. Last time the ratio was clearly declining, but this time the recent rally is large enough to make me question whether this is similar or different. The case remains open on that.
22 1/2 year war cycle last time round in gold price:
Gold price against itself

Observation: This is extremely interesting. A declining downtrend of a mature near swing in gold in both charts!
11 1/4 year war cycle last time round in gold price:
Gold price against itself

Observation: In this timeframe gold has made a historic low causing a major bull to begin. This time round the low is several smaller swings later, and although a breakout may be forming like it did a decade ago, the major low is not present for such a length of time as to gain recognition and "bring in bulls" as it did back then.
9.6 year war cycle last time round in gold price
Gold price against itself

Observation: Similarity abounds, and many of the smaller swings seem to be synchronized! Following this "analog" would entail construction of a new higher support plateau from which a bull could gain strength and then make a continuation of more bullish upwards swings.
The similarities are visually obvious if they exist, or if not visibly obvious are probably non existent. I personally see a series of pending breakouts in past waves when those waves were at a similar stage to today. But allowances must be made and a months or two are neither here nor there in such a basic approach. readers might be interested to try this for themselves, but with shorter term cycles in war or other assets like eg bonds whose prices are encapsulated in the price of gold.
I did find it interesting to remember the major news headline events of those past times and compare with the hottest fresh news of 2014. but that is a different conversation. That aspect is also worth looking into I think.
~~~~~~~~~~~~~~~~~~~~~~~~~~
Sources of related material:
Martin Armstrong on Cycles of War:
https://armstrongeconomics.com/cycle-of-war-political-economy/
Larry Edelson on War Cycles:
Dewey - "Cycles" : https://www.bibliotecapleyades.net/ciencia/cycles/cycles11.htm
Some of Mr Dewey's published work has been used in the charts I have created for this contribution.
~~~~~~~~~~~~~~~~~~~~~~~~~~~
Have a great weekend everybody!
Argentus Maximus
The author posts daily commentary on the gold and silver markets in the TFMR forum: The Setup For The Big Trade. More information about the author & his work can be found here: RhythmNPrice.


