Hi-Ho Silver Silver Charts
I am creating this thread for anyone interested in analysis for the 60/120/240 minute Silver charts.
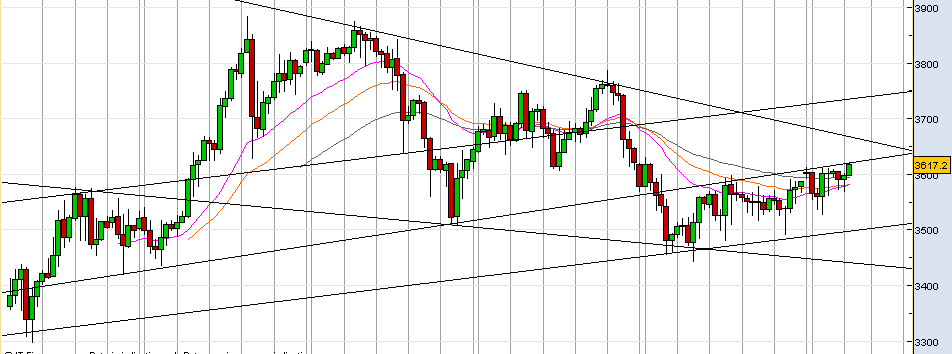
Here is the current 240 minute Silver Chart. We look to be breaking up thru the trendline channel at 36.20. This is the channel which kisses from beneath the Head & Shoulders patterns it dropped thru on 13 June. The pattern did not drop down to a level that would have confirmed the H&S, so perhaps we are in a falling wedge pattern. See link for info about this pattern:
https://stockcharts.com/school/doku.php?id=chart_school:chart_analysis:c...
IF we are indeed in a falling wedge, then we should expect major resistance at next resistance which is at 36.50 which is the TOP of the falling wedge trendline (e for the 31 May and 10 June peaks). Expect strong resistance there.
We have had more than a week of boring action, but TIME will force PRICE to move one way or another.


