


We knew that this week's CoT was going to be interesting but I didn't expect it to leave me speechless.
Look, I know I've been banging this drum for months and all the metals have done is go down. Got it. I read you loud and clear. But we're talking big picture, positioning stuff here. I am 100% firm in my belief that QE∞ caught the bullion banks with their pants down. All of the price action since 9/13/12 has been designed to alleviate the gigantic financial risk and potential liability of being short paper metal. By smashing price, against the fundamentals, from $1800 to $1350 and from $35 to $22, The Cartel Banks have accomplished two things:
Even though it's blatantly criminal, you almost have to give them credit. That they've been able to pull this off in broad daylight is simply astounding. On the level of Oceans 11.
Once again and with meaning: On 9/11/12, two days before the announcement of QE∞ and with gold already at $1800, The Gold Cartel was net short 237,091 Comex contracts. That's 23,709,100 paper troy ounces or about 737 metric tonnes of gold. As of last Tuesday, they are now net short just 59,221 contracts or about 184 metric tonnes. A reduction of just over 75%! Oh, and did I mention that, over the same time period, the GLD has been raided for 277 metric tonnes? Just thought I'd throw that in, too. Simply magnificent! The Crime of The Century! Ah, screw that. That's The Crime of The 20th Century, too!! Amazing.
So, here are your numbers. Keep in mind that, for the reporting week, gold was up $1.30 while total open interest fell ahead of June13 expiration by 35,086 contracts. Also keep on mind that for Wednesday and Thursday of this week, total OI fell another 25,110 contracts. One can only imagine how much more long-term bullish these levels are as of this weekend.
GOLD
For the week, the Large Specs dumped 16,836 longs and added 6,544 new shorts (quite a few of which got squeezed yesterday and put back on today). This brings the Large Spec net long total down to just 56,879 contracts. Do you think that's a lot? Hmmm. What if I told you that, back on 9/11/12, the Large Specs were net long 182,016? From a different perspective, back on 9/11/12, the Large Spec net long ratio was 6.62:1. As of last Tuesday, it was down to1.49:1. And here's a little more perspective for you: At the price lows on 12/27/2011, the Large Specs were net long 130,788 with a ratio of 4.57:1 and at the price lows of last August they were net long 114,304 with a ratio of 3.43:1. Again, as of last Tuesday, the Large Specs were net long just 56,879 contracts and had a net long ratio of 1.49:1.
The Small Specs also reduced their net long position by a little over 1500 contracts and they are now net long just 2,342 total contracts. Again, by contrast, back on 9/11/12 the Small Specs were net long 55,075. That's a reduction of nearly 96%!
And The Gold Cartel. What did they accomplish this week? Not much...No, they just reduced their net short exposure by nearly 25,000 contracts! Again and as stated above, The Gold Cartel is now net short just 59,221 contracts or 184 metric tonnes of paper gold. Back on 9/11/12, they were net short 237,091 contracts or 737 metric tonnes of paper gold. The new Cartel net short ratio is just 1.34:1. This means that they are now long 3 contracts for every four that they are short. Incredible!
Once again for perspective, at the most recent price bottoms near $1525 in Dec of 2011 and August of 2012, The Gold Cartel was still net short 163,932 and 143,940, respectively. Their net short ratios on those occasions were 2.01:1 and 1.98:1. Again, as of last Tuesday, the numbers are 59,221 and 1.34:1.
SILVER
While interesting, the silver CoT isn't nearly as wild as gold. It's still crazy, though, as you'll see. For the reporting week, silver was down about 25¢ and its OI fell by about 3,300.
The Silver Large Specs dumped another 1,474 contracts this week while adding another 2,750 longs. That net long reduction leaves them net long just a little over 4,500 contracts and drops their net long ratio down to an almost inconceivable 1.16:1. Again, consider these levels and dates for perspective:
- On 9/11/12, they were net long 31,482 contracts and had a net long ratio of 4.18:1.
- At the 12/27/11 price bottom, they were net long 6,855 with a ratio of 1.40:1
- At the 8/14/12 price bottom, they were net long 15,407 with a ratio of 1.93:1.
The Small Specs in silver had little change and are of little consequence right now.
The silver commercials continue to astound. Though the everybody-but-JPM crowd sold 1,326 longs last week, they're still gross long an amazing 66,428 contracts. All of this commercial and spec selling allowed JPM and The Forces of Darkness to cover 4,918 shorts, leaving them gross short just 74,762. This commercial net short reduction of nearly 3,600 contracts leaves them net short just 8,334 contracts and an incredibly, nearly-impossibly low net short ratio of just 1.13:1. Again, for perspective:
- Caught with their pants down on 9/11/12, The Forces of Evil were net short 47,272 contracts or 236,360,00 troy ounces of paper silver or about 7,350 metric tonnes. They also had a net short ratio of 2.47:1.
- As of last Tuesday, The Evil Ones were net short 8,334 contracts or 41,670,000 ounces. That's 1,297 metric tonnes or a reduction of over 83%!
- At the $26 price low of 12/27/11, they were net short 14,312 contracts with a net short ratio of 1.34:1
- And at the price low of 8/14/12, they were net short 23,402 with a ratio of 1.49:1
- Again, as of last Tuesday, they are net short just 8,334 contracts with a ratio of 1.13:1
Look, I could probably keep typing for hours about the significance of all of this but I think I'll stop here. All you need to know is this: The Bullion Banks have now reduced their net liability in gold by over 75% and, in silver, by over 83%...all since the game-changing announcement of QE∞ last September. Rather than once again trying to cover into rising prices with disastrous results (see April of 2011 in silver and August of 2011 in gold), an evil, insidious and outright criminal plan was made and executed to crush the paper price of both metals. By flawlessly executing this plan, The Bullion Banks have so reduced their potential liability that there can be no doubt that prices will soon be allowed to rise again. When? That's impossible to say, of course. Maybe not until The BBs are net long both gold and silver. Who's to say for certain? But I do know that we are very, very close to a price bottom here when you take this CoT situation and the physical market demand into consideration. Plain and simple.
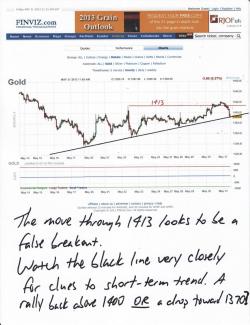
Finally, we'll have to see how things go once trading resumes Sunday evening. The action today certainly brings my Wednesday post back into play...the one where I speculated that one more washout could come before "a surprisingly disappointing NFP number" on Friday. I guessed that another test of $1350 was possible with a stop-running drop in silver to $21.50 or even a double bottom at $21. Again, given today's action and the $10 or so taken out of gold on the Globex this afternoon, that scenario certainly seems possible, if not likely. Here are two charts that I printed this morning, before this afternoon's decline.

So, anyway, keep the faith. Next week promises to be volatile but fun nonetheless. Enjoy your weekend and try to relax a little. Then come back on Monday with your game face on.
TF


