


Though Comex metal "delivery" remains a sham and circle jerk where The Banks simply shuffle paper warehouse receipts and warrants, we thought the latest totals for September were noteworthy enough to bring them to your attention.
Again, we've written about this on countless occasions and this post is not meant to imply that "the Comex is about to break" or that "there is a run on The Banks". Instead, September saw the continuation of two trends of which you need to be aware. Comex "deliveries" are up dramatically in 2017 and JPM continues to stand down.
First, take a look at the historical pattern of "deliveries" during the so-called "delivery months" of March, May, July, September and December. Below is a summary of the "delivery" activity for 2015:

The one way we've always quantified "deliveries" here at TFMR is to consider the total amount of stated "deliveries" at the end of each month versus the total number of contracts that had been left open and allegedly "standing for delivery" at the beginning of the process. For 2015, it looked like this:
Contract Total Standing Total "Deliveries" Percentage
Dec14 3,950 2,975 75.3%
Mar15 3,142 2,583 82.2%
May15 3,371 2,840 84.2%
Jul15 2,699 3,637 134.8%
Sep15 2,198 1,555 70.7%
Dec15 4,078 3,939 96.6%
As you can see, the only outlier in 2015 was the month of July where nearly 1,000 additional contracts materialized requesting immediate "delivery". Other than that, it was a rather orderly process.
Now, let's look at the summaries for 2016.
Contract Total Standing Total "Deliveries" Percentage
Mar16 3,804 1,356 35.6%
May16 5,603 2,716 48.5%
Jul16 2,957 2,474 83.7%
Sep16 3,412 3,215 94.2%
Dec16 3,056 3,980 130.2%
Again, a rather mundane year of silver "deliveries" with one exception. This time, the month of December saw an "oversubscription". Where Jul15 had seen "deliveries" exceed standing by 938 contracts, Dec16 saw the same exception to the tune of 924 contracts. Other than that, it was another somewhat orderly year.
So let's move on to consider the "delivery" action in 2017 to see if anything unusual is taking place:
Contract Total Standing Total "Deliveries" Percentage
Mar17 7,299 3,872 53.1%
May17 3,360 4,657 138.6%
Jul17 2,423 3,287 135.7%
Sep17 4,103 6,575 160.2%
Well now. This is beginning to look a bit different, isn't it? Go back up and review the data for 2015 and 2016. Note that only one month in five ever shows a "delivery" total in excess of the amount of contracts still open before First Notice Day. And now, if we include last December, we've seen this occur in four of the past five months with the most recent "delivery month" of September seeing the largest percentage "oversubscription" yet at 160.2%
And when we look at it in absolute terms, the "deliveries" for last month get even more interesting. Note that there were 4,103 contracts still open when the contract went off the board on August 30. At 5,000 ounces per contract, that's a total potential "delivery" obligation of 20,515,000 ounces of silver or about 638 metric tonnes. By the end of the month, the Comex had actually "delivered" 6,575 contracts for 32,875,000 ounces of silver or about 1023 metric tonnes.
So, what's the deal here? Why the sudden rush in 2017 to jump the queue and take immediate "delivery" instead of simply waiting until the next "delivery month"? Could it indicate wholesale physical tightness? Could it indicate a lack of trust amongst The Banks? Could it indicate absolutely nothing?
Well, one thing we know for certain is that this anomaly is not being caused by the House or proprietary account of JPMorgan. Recall that in March we caught JPM blatantly exceeding that stated front-month position limits for Comex silver. We wrote about it at the time and even went so far as to file a formal complaint with the CFTC: https://www.tfmetalsreport.com/blog/8243/march-comex-silver-deliveries
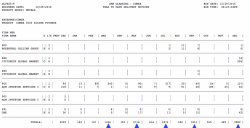
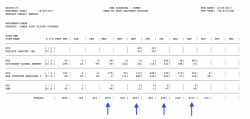
Back in July, we next noticed that the House Account of JPMorgan had completely discontinued all "delivery" activity in Comex silver: https://www.tfmetalsreport.com/blog/8451/specific-peculiarity
Well guess what...that trend has continued through September. See below:

So, at the end of the day, what do we make of all this? I guess that's up to you, the reader, to decide. No doubt "deliveries" in Comex silver have increased dramatically in 2017 but what is a "delivery" anyway? Is it actual metal or just an exchange of warehouse receipts between Banks, made to create the illusion of physical delivery for their paper derivative market? And does this increase in "deliveries" translate to physical demand and Comex stress or is it just emblematic of the general increase in total Comex silver open interest?
These are all interesting questions and, unfortunately, these deliberately-opaque "markets" make it impossible to state the answers with certainty. One thing is certain, however, and that is the notion that no institution built upon fraud, lies and deceit will stand indefinitely. Eventually, this current paper derivative pricing scheme will fail as true physical demand overwhelms The Banks' ability to manage their unallocated and fractional reserve system. For that day, we continue to prepare accordingly.
TF


