


One of our site sponsors has been MiningStockValuator.com and you've likely noticed their ad on the right side of this homepage. As a service to the greater community, they've written this terrific article.
When finished reading, be sure to check out https://www.miningstockvaluator.com. If you're investing in and trading the miners, you'll likely find their services to be invaluable.
The Value of Silver
Written by the MSV Team
Dec 19, 2012
Whether you know it or not, silver probably plays a big part in your life. With the new high-tech era, silver can literally be found everywhere. It's in your iPhone, your new LCD TV and laptop, and you're staring at it when looking at yourself in the mirror. This is a result of silver being the best conductor of electricity out of all metals as well as an excellent reflector of light. Silver has gone from limited industrial use in the photography sector to one of the most crucial ingredients in modern technology. Many experts claim that silver is the most important metal we have, as our way of life wouldn't be the same without it.
You are most likely aware of silver's outstanding price ascent over the past 10 years, but what is really driving the current bull market in silver and how far will it go? And is there such a thing as a fair value of silver? In this article we will try to delve into most of the factors in the tiny silver market and try to at least get an idea of how to answer such questions. We will also make a lot of historical comparisons, since history, as Mark Twain once noted, does not repeat itself, but it does rhyme.
Silver as money
Silver was first mined some 6,000 years ago in today's Turkey. It has since been used for mainly two things: jewelry for its beauty and transactions for its wide acceptance as money. The first silver coins were minted around 600 B.C. and silver has throughout history actually been used more often and widespread than gold in transactions.
The apparent reason seems to be silver's suitability for daily trade compared to gold's much greater purchasing power per unit of weight. The chemical symbol for silver is "Ag" derived from the Latin word "argentum" which translates into "money". That should say something about the extensive history of silver considered as money.
The British and Roman Empires are two examples in history of silver being utilized as money. The two powerhouses of today's world economy, the U.S. and China, are no exception. Silver was regarded as legal tender in the U.S. from 1792 up until 1873 when the country abandoned the bimetallic standard for a gold standard.(1) China finally abandoned the silver standard in 1935.(2)
Supply and demand
Despite an almost 10-fold increase in the price of silver over the past decade, the mine supply has only risen a modest 28%(3). One reason could be the many years it takes to bring a new silver discovery into production, but it doesn't explain why we're still not seeing any notable boom in new mine supply today.
A more important factor has to do with how silver is mainly produced. There are very few pure silver producers out there and most of the silver production is in by-product form from mines targeting industrial metals like copper and zinc. The price of silver only plays a minor role in these mines' profitability, so a price spike might not necessarily mean a corresponding incentive for the producing companies to raise their output. On the other hand, a slowing world economy and lower copper, zinc and lead prices might lead to a drop in total silver production.
On top of that, the whole mining industry has been hit with huge increases in production costs due to more expensive energy, labor and equipment. Diminishing grades contribute to the rising costs as the mines have to process more ore to produce the same amount of silver. So even with the long-term trend of silver prices intact, we will most likely not see any huge jump in production in the foreseeable future.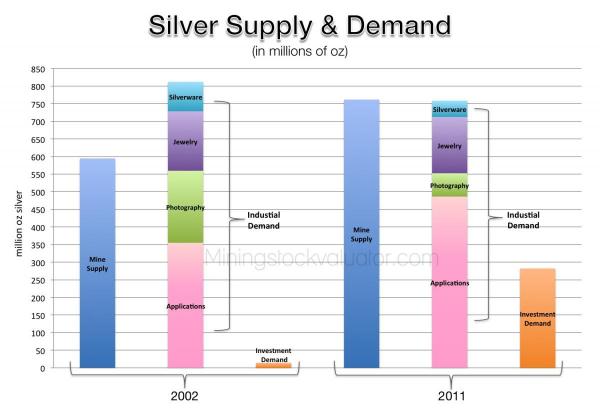
source: [https://www.silverinstitute.org]
As the chart above shows, photography is no longer a major factor for demand while industrial applications are soaking up a big chunk of the available supply. This trend should accelerate as hundreds of millions of people in emerging countries are making their way into the middle class, wanting the latest mobile phones and 50 inch TVs. "Green energy" is also a big contributor to the rosy future of industrial demand as solar cells and windmills are very silver dependent. Silver's industrial demand is also less linked to price than many other raw materials due to the small amounts used in various applications. A TV manufacturer could easily offset the effects of a doubling of the silver price by raising the price of TVs by $40 - hardly enough to scare off the public from getting a new flat-screen.
Investment demand has been the big gainer over the last decade with an astonishing increase of almost 1900%(4). Many Asian countries have traditionally been more inclined to put savings in precious metals than their Western counterparts. China is now openly encouraging its people to put savings into gold and silver, while the second most populated country India sees a lot of people turning to silver when the more expensive gold is knocking on the door to $2000 per ounce.
ETFs and other investment vehicles have made silver more accessible to the man on the street. ICBC, China's and the world's largest bank in terms of market capitalization, made a game-changing announcement when they opened up the gates for clients to buy silver products via their personal bank accounts. The following statement(5) was made by the ICBC a few months later:
ICBC silver trading service for personal account enjoys blistering growth since the launch in August this year nationwide. Transaction volume and amount grew by several times every month. ICBC set a new record in November by having a jump of 191% over previous month to 4852 tonnes in transaction volume and an increase of 231% over previous month to RMB 27.888 billion in transaction amount. By the end of November, a total of 7167 tonnes have been traded by ICBC customers through silver trading service for personal account.
Add that several futures exchanges recently have launched silver futures into the mix and the growing investment demand is here to stay.
Historical relationships
Most of the participants in today's markets have little knowledge of historical patterns and their implications. To understand the future one has to understand the past. So, what can history teach us regarding silver?
To answer that question we will open up the records and compare the value of silver to several important indicators now and then. We have also chosen to have a closer look at the years 1960, 1980, 2001 and 2012. 1960 to show how things were before the last bull market of silver took off. The peak of 1980 should give a hint of what signals that mark a top. 2001 marks the start of the current bull market and 2012 is simply this year.
Though sometimes a bit misleading, the nominal silver price in U.S. dollars is what people see. During the two decades of the 1960s and 1970s the price of silver blasted from below $1(6) per ounce all the way to $50(7) in January of 1980, a 54-fold increase. A similar appreciation today would ultimately drive silver from the 2001 rock bottom(8) of $4 per ounce to above $200.
But to set a goal of the silver bull market solely based on a previous increase could be a bit misguided. There are many things affecting the outcome, not the least of which is the supply of the currency that silver is priced in – a factor covered more in depth later on in this article.
Silver vs. Gold
The relationship to gold is often considered an important factor in the calculation of a “fair value” for silver. In the earth's crust there is roughly 19 times more silver than gold, a relationship that has often been reflected historically, as silver on average has been considered to be worth somewhere between 1/10 and 1/16 of gold's value.(9) A commonly used term for this relationship is the gold-to-silver ratio or the GSR.
Gold's little brother more than doubled its relative value to gold during the last precious metals bull market and the GSR finally bottomed out at 17:1, using the London fix for gold and silver prices. Today we are seeing a ratio of approximately 51:1, not much of a drop since the GSR stood at 67:1 at the birth of the now more than a decade-long uptrend. It has been down testing lower levels though, and as recent as early 2011 it made it all the way down to around 30:1.
There are other factors in support of a smaller difference in price. Produced silver in 2011 only surpassed gold(10) by 8.5 times which also speaks for a ratio close to the historic range of 10:1-16:1. A look at the current value of all above ground gold and silver gives an even more skewed picture of today's ratio.
Most of the nearly 5.5 billion ounces of gold ever produced(11) is still around. Even with an assumption of nearly 30% vanishing throughout the years, the approximate 4 billion remaining ounces make up an impressive market value of almost $7,000 billion or $7 trillion. The same number for silver using a generous number of 1 billion ounces above ground is $34 billion or 1/200 of gold's value at today's prices.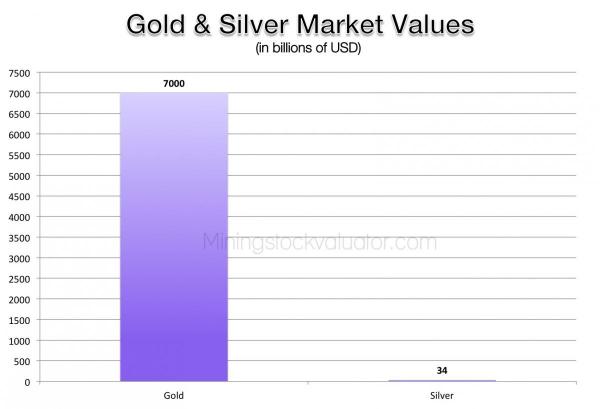
As silver has been more plentiful than gold throughout most of history, one could easily argue that with today's setup, the gold-to-silver ratio should reverse back closer to the historical norm, despite the current lack of official monetary status.
U.S. GDP
The Gross Domestic Product is the total value of all goods and services produced during one year. If the current economic deterioration were to continue and silver's monetary heritage comes out in full swing, comparing silver to a nation's GDP makes sense.
source: [https://research.stlouisfed.org/fred2/data/GDP.txt]
In 1960 it took 576 billion oz silver to buy the U.S. GDP. Two decades later that number was down to 55 billion ounces – a more than 900% increase in purchasing power in terms of the GDP.
The following 21 years resulted in a drop of 98% since the 1980 peak and if you 2001 wanted to exchange your stacked silver for the entire GDP it would cost you dearly: 2549 billion ounces.
Using the latest GDP number released by the St Louis Fed in July 2012 you get a lot more GDP for your silver and if you have 457 billion ounces lying around, you know what to do.
To get back to old peak levels around 55 billion ounces, silver needs to gain another 700% compared to the GDP. A heavy fall in the GDP seems unlikely with the easy money policies still intact, so it is probably up to silver to catch up.
The Money Supply
As more and more savers buy the white, shiny metal instead of putting their cash in the bank, it is definitely worth having a look at the amount of money in the system. After all, an expanding money supply means more dollars that can buy silver.
We will have a peek at the M2 money supply, especially since the Fed stopped reporting the M3 figures some years back. M2 includes currency in circulation, traveler's checks, demand deposits, other checkable deposits (OCDs), time-related deposits less than $100,000, savings deposits and retail money-market funds.(12)
source: [https://research.stlouisfed.org/fred2/data/M2NS.txt]
Measured in silver, the M2 money supply of the U.S. stood at 329 billion ounces in 1960. Twenty years and a stagflationary crisis later you got approximately 30 billion ounces of silver for the entire U.S. M2 money supply; an even more impressive achievement when keeping in mind that the M2 quintupled over the same period from below 300 billion dollars to almost 1500 billion dollars.(13)
The present bull market once again shows how silver is rising faster than the output of the digital printing presses. A M2 money supply equal to 1,315 billion (1.315 TRILLION) ounces in November 2001 has turned into 293 billion oz of silver by September of 2012. In other words we're currently seeing the levels we had in 1960, before silver had even started to take off.
Without any further increase in the current M2 money supply of $10,200 billion(14), today it would take a silver price of $340 per ounce to copy the ratio between silver and the M2 money supply back in January of 1980.
Labor
The most consistent demand in the history of markets is perhaps the demand for labor. In a way, the cost of labor priced in silver might be the most appropriate measuring stick when determining a fair value.
Back in the old days, how much silver did a hard worker in the U.S. earn in exchange for his blood, sweat and tears? And what does he make today?
Old wage statistics reveals the significant purchasing power silver used to have. From 1761 to 1860, the average laborer's salary was 87 grams or roughly 2.8 ounces of silver per week.(15) This amount had to be enough to cover a family's weekly expenditures on food, housing, clothes etc. - something you could hardly do today with 87 grams of silver and the corresponding value of less than $100.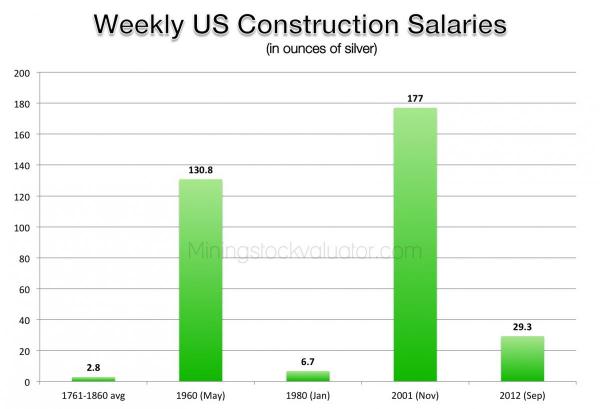
sources:
[https://www.iisg.nl/hpw/data.php]
[https://fraser.stlouisfed.org/publication/?pid=60]
[https://research.stlouisfed.org/fred2/series/CEU2000000011]
Scrolling forward a century to 1960, the value of silver had dropped significantly and a U.S. construction worker cashed out 130.8 ounces of silver a week.
While salaries continued to rise in dollar terms during the next two decades, it was not the case from a silver perspective. The decline of salaries measured in silver did not stop until it reached 6.8 ounces per week in early 1980, a decline of almost 95%.
A similar trend seems to be in place since 2001 when silver might have reached an all-time low in terms of salaries. A week of work rewarded the same construction worker with $720(16), equal to 177 ounces of silver at the time.
In September of this year, that paycheck has risen to $1021(17) – a sweet 42% increase. However a worker's joy might turn into disappointment if silver once again is added to the equation. $1021 bought a lot less silver in the fall of 2012 than $720 did in 2001, only 29.3 ounces to be more precise.
Still, there's a lot room left for silver to catch up to get back to the levels seen in 1980, not to mention the historic relationship between silver and U.S. salaries.
The Future
You could argue that the forces driving the value of silver higher in the past are back with a vengeance and even more apparent today. The economic imbalances of today are unprecedented, so it is hard to see the escalating investment demand going away anytime soon. Industrial demand for silver has a bright outlook as well as it is one of the most crucial metals in the new technology boom.
At the same time, the world is a smaller and more integrated place today than it was 32 years ago, and a lot more people have access and the means to participate in the silver market. If the current trend continues, it won't be a question of if, but rather when supply no longer will keep up with demand.
After studying all the prior relationships between silver and various historical and present data, is it possible to draw any conclusions as to where silver prices will go over the coming years?
Setting an ultimate target for silver in dollars is nothing but a wild guess and something we will leave for others to do, but history hints that the metal should increase its purchasing power at least fivefold in relation to salaries, the U.S. money supply and the U.S. GDP before this run is over. We see no reason to disagree.
Sources:
1. [https://www.enotes.com/coinage-acts-reference/coinage-acts]↩
2. [https://www.globaltimes.cn/business/world/2009-07/446855.html. ]↩
3. [https://www.silverinstitute.org]↩
4. [https://www.silverinstitute.org]↩
5. [https://www.icbc.com.cn/icbc/sy/]↩
6. [https://www.kitco.com]↩
7. [https://www.lbma.org.uk]↩
8. [https://www.lbma.org.uk]↩
9. [https://articles.businessinsider.com/2011-03-30/markets/30094444_1_silve...↩
10. [https://www.bloomberg.com/news/2012-04-05/top-10-gold-producing-countrie...↩
11. [https://www.numbersleuth.org/worlds-gold]↩
12. [https://research.stlouisfed.org/fred2/series/M2]↩
13. [https://research.stlouisfed.org/fred2/data/M2NS.txt]↩
14. [https://research.stlouisfed.org/fred2/data/M2NS.txt]↩
15. [Global Price and Income History Group - https://www.iisg.nl/hpw/data.php]↩
16. [https://fraser.stlouisfed.org/publication/?pid=60]↩
17. [https://research.stlouisfed.org/fred2/series/CEU2000000011]↩


