


This is way more charts than I've ever given you in one post. I hope you're ready.
For now, the metals are both being contained below their 200-day moving averages of gold at $1667 and silver at $30.82. So, while the metals continue in a holding pattern, I thought that today would be an excellent day to give you this massive update and, perhaps, make some general assumptions about 2013.
The problem with doing this is knowing where to start and how to put these into an order that makes some sort of logical sense. Since "logical sense" eludes me at this moment, I'm just going to dump them on you, instead.
First up, here are daily charts of the euro and copper. Note how closely they tracked each other through 2012. Actually, it would probably be more accurate to say "look how closely copper tracked the euro". Also notice how both declined in mid-December but recovered in late December.


Now look how closely silver has also tracked the euro in 2012. Note that silver fell in mid-December, too, but did not see the rebound that copper did. Hmmm. Is paper silver undervalued by 10%?

Next, let's look at the bond market. I've suggested to you that QE of $85B/month is not enough to fund the 2013 deficit, which looks to be in the $1.6-1.7T range. Falling prices/rising rates would also suggest that more Fed "support" is needed in the bond market. My guess is we'll see it soon...probably when the 10-year approaches the 127-128 level and the Long Bond is threatening to break down through 140.


Let's begin the currency discussion with the POSX. Remember and never forget that the POSX is simply a reflection of The Pig versus other rapidly-devaluing fiat currencies. The fact that the POSX is flat over the past five years only means that other global fiat have declined in value by an equivalent amount.

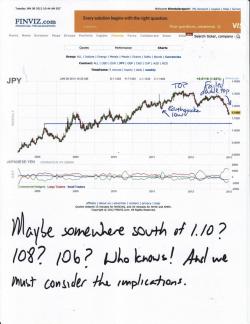
So, in that context, look at The Pig vs the yen. Yikes! Were you aware of this? We'll definitely need to watch this relationship over the next few weeks and months.

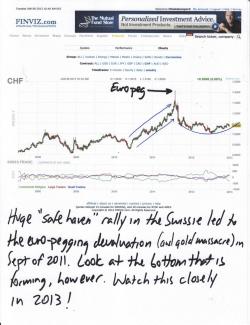
Another very interesting currency chart is the Swissie. From mid-2010 through mid-2011, the Swiss franc rallied almost 40% as it was perceived to be the final and only "safe haven" fiat currency. Well, the Swiss didn't like that too much as they keynesian-foolishly feared that a strong franc would wreck their economy. So, they did what all centrally-planning keynesians do, they devalued by pegging the swissie to the euro in early September of 2011. (Recall, too, that this left gold as the only remaining "safe haven" currency and it was carpet-bombed a full five minutes before the announcement was made and has been firmly held in check ever since.) Well, now, the swissie (and, by extension, the euro) has begun to form a massive, bowl-shaped bottom on this weekly chart. Hmmmm....could this foretell a POSX breakdown in 2013?
Let's now switch to crude, where a trading opportunity may be developing. (Full disclosure: Like most everything else, I missed the boat quite often in crude in 2012.) Look at these charts. A pullback to 91-92 would sure seem to present a buying opportunity for a move to 98-100. From there, a consolidation would paint the chart with a massive, cup-and-handle formation and would make the chart look like 115+ by mid year.


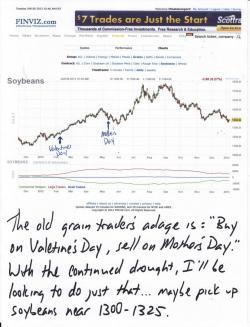
The old adage among grain traders is "buy on Valentine's Day and sell on Mother's Day". That strategy certainly looks like a good idea in 2013, too. The drought in the U.S. Midwest has not lessened at all this winter ( https://droughtmonitor.unl.edu/12_week.gif) so you can rightly expect some rapid gains this spring if the next growing season begins dry, too. I'll definitely be looking to dabble in beans next month, especially if price can fall a bit further, toward $13.
And this is interesting. Have you been to the market lately and thought, "Damn, that shit's expensive" when looking at steaks and burgers? If so, this next chart will show you why. It's a weekly chart of Live Cattle and note that since the advent of Quantitative Easing in 2009, beef prices have risen over 60%. Is your salary up by 60%, too? No? Hmmm...the major problem here is that soaring "protein" prices will ultimately lead to civil unrest, first in the 3rd world but, eventually, here in The West, as well. Watch this closely in 2013 as it has the potential to develop into a real problem.

And get a load of this next chart...Lumber. Apparently lumber didn't get the memo post-QE∞. Since mid-September, it's up over 40%. Permanently low rates means a housing recovery? I don't think so but clearly the lumber market does! Either this sucker rolls over soon or, eventually, a lot of other commodities are going to have to play catch up. Another chart to watch closely in the weeks and months ahead.

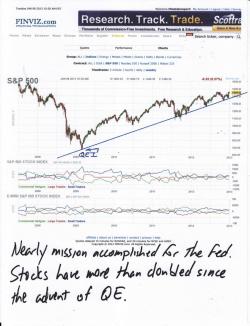
And, finally, here's the S&P. I guess we're all just dumb-as-a-box-0f-rocks for buying metal over the past four years when we could have been buying and holding stocks, instead. UP over 100% since the initiation of Quantitative Easing in March of 2009, more than just about any other paper "asset" and you get a dividend! Isn't it interesting that all of this money printing leads stocks higher than everything else? Gee, I wonder why that could be?
Perhaps THIS has a little something to do with it. Please take the time to read this very important and informative article from ZH. It's one of the most important things they've written in quite a while. https://www.zerohedge.com/news/2013-01-07/dear-steve-liesman-here-how-us-financial-system-really-works
And buried within that article is the paragraph near-and-dear to my heart and the hearts of all of Turdville. This is the mechanism through which JPM conceals their manipulative actions from the CFTC and everyone else:
"Now the JPM spin is well-known: the CIO was merely there to "hedge" exposure, as a direct prop bet would be illegal as per the Volcker Rule, not to mention the avalanche of lawsuits and the regulatory nightmare that would ensue if it became clear that the firm was risking what amounts to deposit capital to fund massive, highly risky prop trading bets. Which, when one cuts out the noise, is precisely what JPM did of course, especially since the "hedge" trade blew up just as the market tumbled in the spring of 2012, a time when it should have otherwise hedged the balance of the firm's otherwise bullish posture. That it did not do this refutes the logic that this was a hedge, and confirms that what JPM was doing was nothing short of using an internal, heavily shielded hedge fund, which had $323 billion in collateral as investable equity, to trade away, knowing very well no regulator would dare touch JPM."
OK, that's all for today. I look forward to reading your comments.
TF


