


As you know, I like to poke fun sometimes at the chartists and the elliotts for relying so heavily upon their squiggly lines that they fail to see the forest from the trees. At the risk of seeming hypocritical, I thought I'd show you some charts that include those squiggly lines this evening as I continue my search for tradable bottoms.
Before we begin, a recap of today and a repost of the charts I included as an update to the earlier blog. To simply summarize, yes today was great. Both metals broke free of their recent downtrends and looked good doing it. However, keep in mind that today was a Tuesday and "Happy Tuesday" often results from The Cartel covering some shorts in an effort to "paint" the CoT survey that took place after the close this afternoon. Because of this, do not be surprised to see the metals give back some of today's gains tomorrow. Additionally, let's be sure to check the OI numbers from today when they are released tomorrow. If new money was driving today's gains, we will see a nice increase in OI. If today was primarily a Cartel short-covering event, the OI will be relatively flat. Regardless, the gains in price are real and both metals suddenly have a much improved technical picture. Let's see what the rest of the week brings. To really get me excited, silver needs to close above $30.50. Gold needs to first close above $1650. Then it needs to break the downtrend line from the highs of September. That line is currently near $1680.


OK, now let's look at two, other technical indicators as we search for a bottom. First, a disclaimer:
Look, we all know that the metals are blatantly and selfishly manipulated by The Cartel. In fact, my ability to accurately forecast price is primarily due to my understanding of this manipulation. However, as you know, the major spec money in the pits is driven primarily by HFT algos and technical indicators are some of the primary factors that cause the algos to switch from buy to sell and vice versa. So, technical analysis indicators are occasionally quite helpful in that, in the closed-loop of single market trading, if all participants are looking at the same information, price forecasting almost becomes a self-fulfilling prophecy.
So, here we go. Let's look at two of the major indicators and see if they are telling us anything. First up,
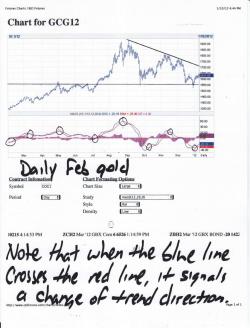
MACD
Definition: https://stockcharts.com/school/doku.php?id=chart_school:technical_indicators:moving_average_conve
Now look at these pretty charts. The blue line is the one you want to watch. Note that the blue line often bottoms shortly after price bottoms OR tops shortly after price tops. What you are looking for are price trend changes that are signaled by the blue line crossing over the red line. Look closely. Maybe print these off yourself. Notice that, recently, the blue line crossed UP through the red line in both gold and silver. This is good news!

And the other technical indicator we need to review is the...
RSI
Definition: https://stockcharts.com/school/doku.php?id=chart_school:technical_indicators:relative_strength_index_rsi
The RSI only gives you only line to follow. When the line reaches way up over 70, the commodity is generally considered to be "overbought" and subject to a decline. Conversely, when the line is down near 30, the commodity is considered to be "oversold".
First, on the gold chart, note that lows in the RSI have generally occurred one week before lows in price and a couple of weeks prior to price trendline breakouts. Also note that the RSI itself will breakout from downtrends and, when it does, it usually portends higher prices. In silver, we get a similar picture. Pay special attention to the longterm RSI trendline. It has been downsloping since May and it just broke out back at the first of the year. This is a very encouraging development.


Again, secondary technical indicators are not the be-all-end-all that many chartists make them out to be. However, they can occasionally be helpful when looking for trend changes in price...kind of like what we are currently doing. When you combine the RSI, the MACD, the price charts and the OI numbers, you begin to get a sense that we have seen the bottom in both metals . Let's now just patiently wait for price to confirm these developments.
TF


